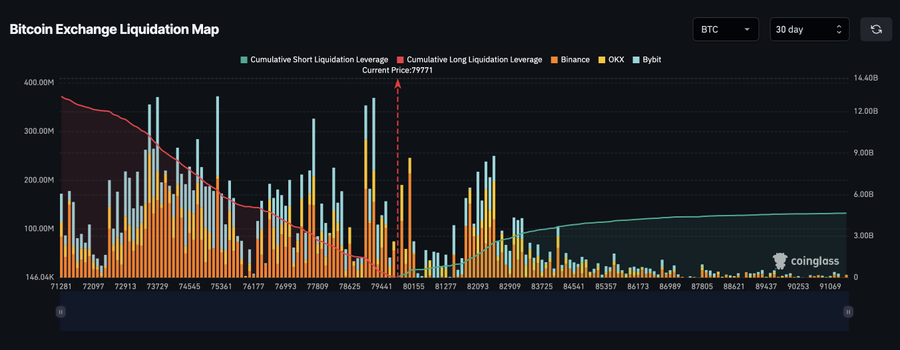
Data from the Bitcoin liquidation map shows a significant imbalance in derivatives market liquidity, with most liquidation clusters concentrated below the current price level.
This means that any sharp downside move could trigger a cascade of long liquidations, potentially accelerating volatility and pushing prices lower at a rapid pace.
The chart also highlights relatively weak liquidity above current levels, while downside liquidity zones remain heavily stacked, increasing the probability of fast downward moves if selling pressure intensifies or market risk appetite weakens.
Traders closely monitor liquidation maps because they often reveal price areas where aggressive market moves can occur as leveraged positions are forcefully closed in sequence.