
CryptoQuant data through June 26, 2026, points to weakening demand as unusual trading activity signals rising volatility.
Bitcoin may appear calm on the surface, but on-chain data suggests the market could be approaching a significant move. According to blockchain analytics firm CryptoQuant, periods of unusually low trading activity followed by sudden spikes in volume have historically preceded major price swings.
The world's largest cryptocurrency has remained below the key psychological level of $60,000 since early June, with investors closely watching demand indicators for clues about its next direction.
Demand Weakness — Not Selling Pressure — Is Driving the Correction
CryptoQuant argues that Bitcoin's latest correction is primarily the result of falling demand rather than increasing supply.
Several key indicators support that view:
Spot Bitcoin ETFs have experienced sustained net outflows after providing strong support throughout 2024 and 2025.
30-day demand growth has fallen to -74,000 BTC, its weakest reading since U.S. spot Bitcoin ETFs launched in January 2024.
The Coinbase Premium Index has remained negative, signaling weak institutional demand from U.S. investors.
Realized Capitalization declined from $1.12 trillion to $1.08 trillion, representing roughly $40 billion in capital leaving the Bitcoin network.
Largest Weekly Demand Contraction Since 2022
One of CryptoQuant's most notable findings is a 652,000 BTC contraction in combined spot and futures demand over the past week.
According to the firm, comparable declines have occurred only three times since 2019:
The COVID-19 market crash in March 2020.
The 2022 FTX collapse.
The 2019 bear market slowdown.
Historically, similar conditions have appeared near major market bottoms, although additional volatility often followed before a sustained recovery began.
Spot Trading Volume Falls to Multi-Year Low
Spot trading volume across centralized exchanges dropped to approximately $679 billion in April 2026, marking its lowest level since October 2023.
CryptoQuant notes that periods of exceptionally low trading activity often leave the market vulnerable to sharp price movements once buying or selling momentum returns.
Low volume combined with a narrow trading range has frequently preceded significant volatility in previous market cycles.
Short-Term Holders Show Signs of Capitulation
On-chain data also shows that 53,800 BTC were transferred to exchanges within a single day from wallets holding coins at a loss.
Notably, none of the transferred coins were in profit, making it one of the most loss-driven selling events of 2026 and suggesting fear-driven exits from investors who accumulated Bitcoin near $80,000.
What the Charts Suggest
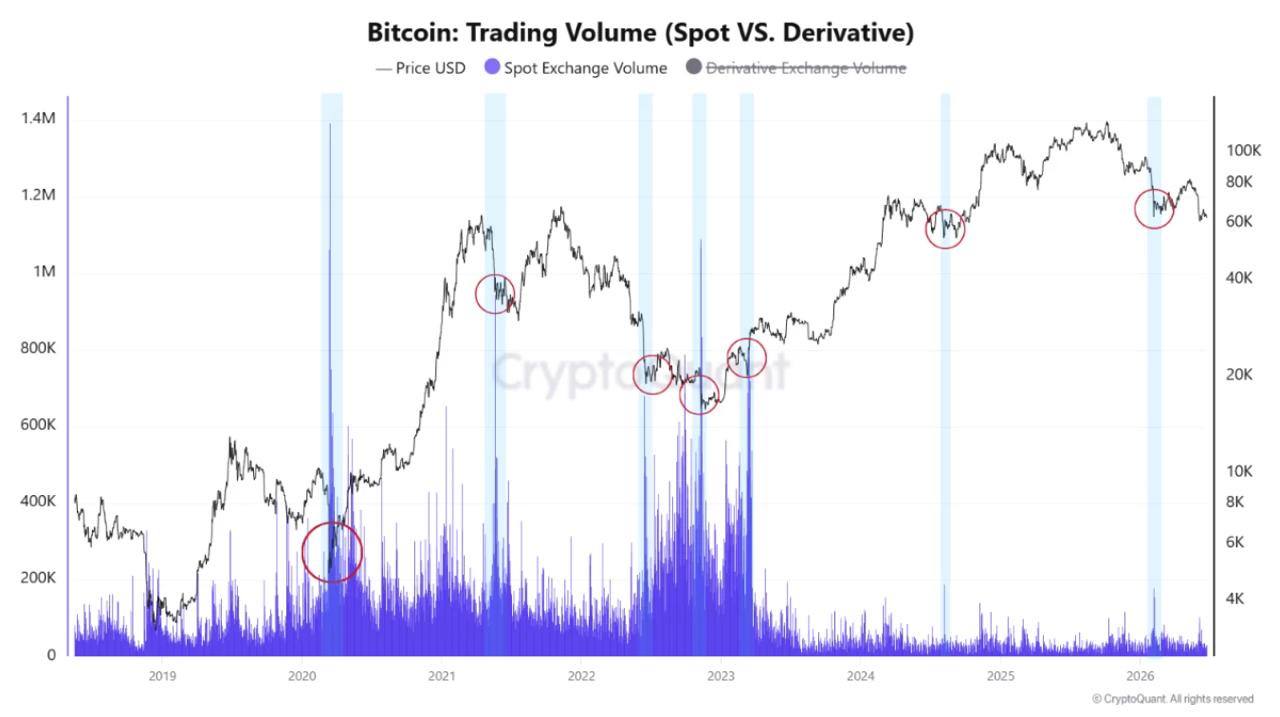
Spot Exchange Volume
CryptoQuant's spot volume chart shows that previous spikes in trading activity were often followed by major price movements. The latest surge coincided with Bitcoin's break below $80,000.
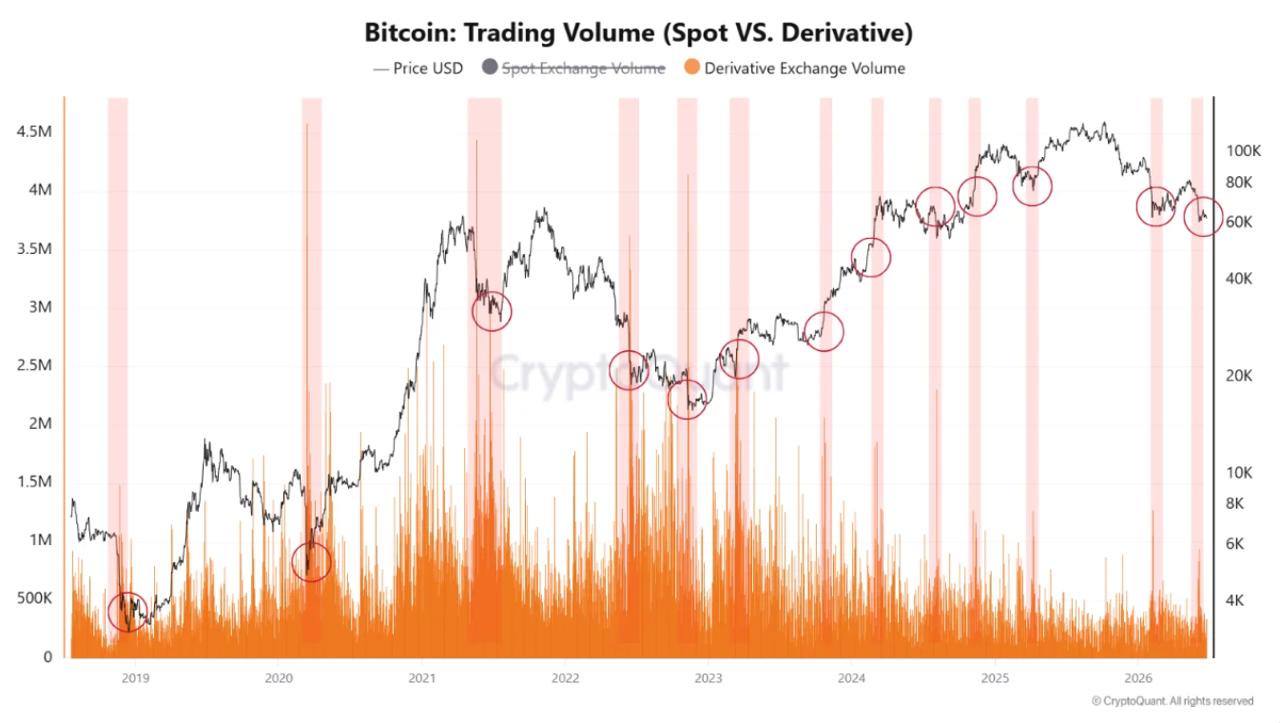
Derivatives Exchange Volume
Trading volume in derivatives markets has historically produced even stronger signals. Similar spikes preceded major market bottoms during both 2022 and 2023, while the latest increase occurred as Bitcoin traded within the $60,000–$70,000 range.
CryptoQuant emphasizes that volume spikes do not predict direction, but they often signal that a period of heightened volatility is approaching.
Key Support and Resistance Levels
Support
Realized Price: Approximately $53,600.
Historically, Bitcoin bear markets have often found support near or slightly below the realized price.
Resistance
200-day Moving Average: Around $82,400.
CryptoQuant considers this level a significant technical resistance following the recent rebound.
Are There Any Bullish Signals?
Despite weakening demand, CryptoQuant highlights two developments that could improve market sentiment:
Binance recorded approximately $7.6 billion in daily spot trading volume during Bitcoin's decline from $118,000 to $113,000. Historically, similar volume spikes have coincided with local market bottoms.
Federal Reserve net liquidity increased from $6.0 trillion to $6.17 trillion, a trend that has historically supported risk assets, including cryptocurrencies.
Four Indicators Worth Watching
CryptoQuant says investors should closely monitor:
-
Net inflows into Spot Bitcoin ETFs.
-
A return of the Coinbase Premium Index to positive territory.
-
Renewed growth in Realized Capitalization.
-
Improvements in global liquidity conditions and capital rotation away from AI-related equities toward digital assets.
Bottom Line
According to CryptoQuant, Bitcoin's June 2026 decline appears to reflect a demand-driven correction rather than a supply-driven selloff.
Long-term holders have not shown signs of widespread distribution, while exchange balances remain relatively low by historical standards. The primary challenge remains the lack of new buying demand.
Although trading volume spikes alone cannot predict whether Bitcoin will move higher or lower, history suggests they often precede periods of elevated volatility.
As a result, the coming weeks may prove critical in determining whether Bitcoin is approaching a durable market bottom—or preparing for another major swing.
Disclaimer: This article is based on CryptoQuant data and analysis available through June 26, 2026. It is intended for informational purposes only and should not be considered investment advice. Cryptocurrency investments involve significant risk.