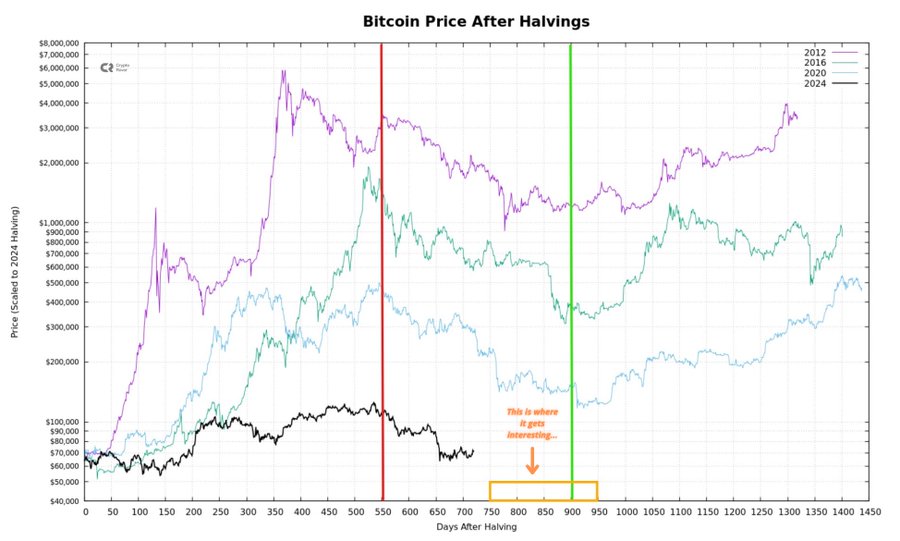
Historical data suggests that Bitcoin follows a recurring 4-year cycle tied to halving events.
The chart compares previous cycles (2012, 2016, 2020) with the current one, showing a consistent pattern in price behavior over time.
One key observation is that major bottoms in previous cycles did not form immediately, but rather after extended periods of decline and redistribution.
Current analysis indicates that the market may still be within this timeframe, suggesting that more time could be needed before a true bottom is established.
Timing expectations
Based on historical patterns, Q4 2026 remains one of the most likely periods for a potential bottom, assuming the cycle continues to behave similarly.
Market behavior
- Long-term trends are driven by liquidity and cycles
- Narratives often follow price, not the other way around
- True bottoms form when confidence is exhausted
Conclusion
While the market shows signs of stabilization, historical patterns suggest that timing—not just price—will be the key factor in identifying the final bottom.